Quickstart
Quickstart: from install to your first session
Get productive with Claude Session Monitor in five minutes — open the sidebar, read a session, open the dashboard, and jump around with Quick Open.
Claude Session Monitor is a VS Code extension for browsing, analyzing, and resuming your Claude Code sessions right inside the editor. If it's already installed, this guide walks you through the shortest path — five minutes, start to finish.
Open the Claude Sessions sidebar
The fastest way in is the activity bar:
- Click the Claude Sessions icon in VS Code's activity bar.
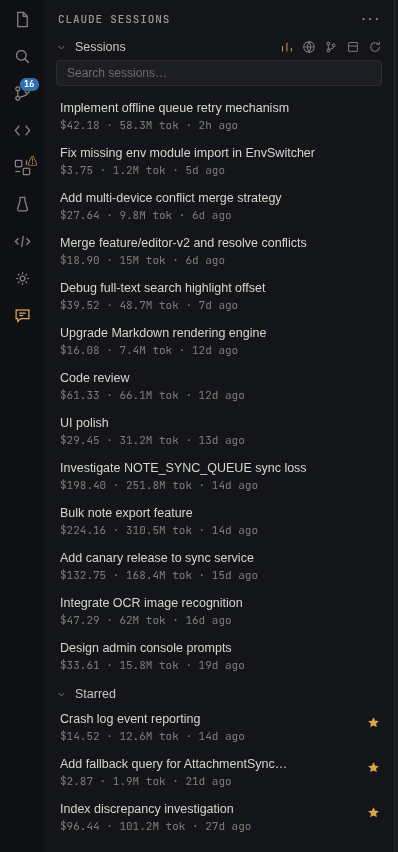
- The extension scans the JSONL session files under ~/.claude/projects/ and loads your session list within a few seconds.
If you haven't run Claude Code yet, or there are no session files under ~/.claude/projects/, the view will be empty — run a Claude Code session first, then come back.
Read the session list
By default, sessions are grouped by repository → git branch; you can switch to a flat, time-sorted list instead. Each group shows a live count, and the session you're actively working in is highlighted.
- Use the built-in search to filter by title, repository, or branch.
- Star a session to add it to a dedicated favorites group, so you can find it again quickly.
- Toggle the scope between all repositories and just the current workspace repository when you only care about the project you're in.
- Timestamps are relative ("3 minutes ago"), so it's easy to spot the most recent activity.
Hover over any session to reveal quick actions: Resume, Star, Rename, and Delete.
Open a session's detail panel
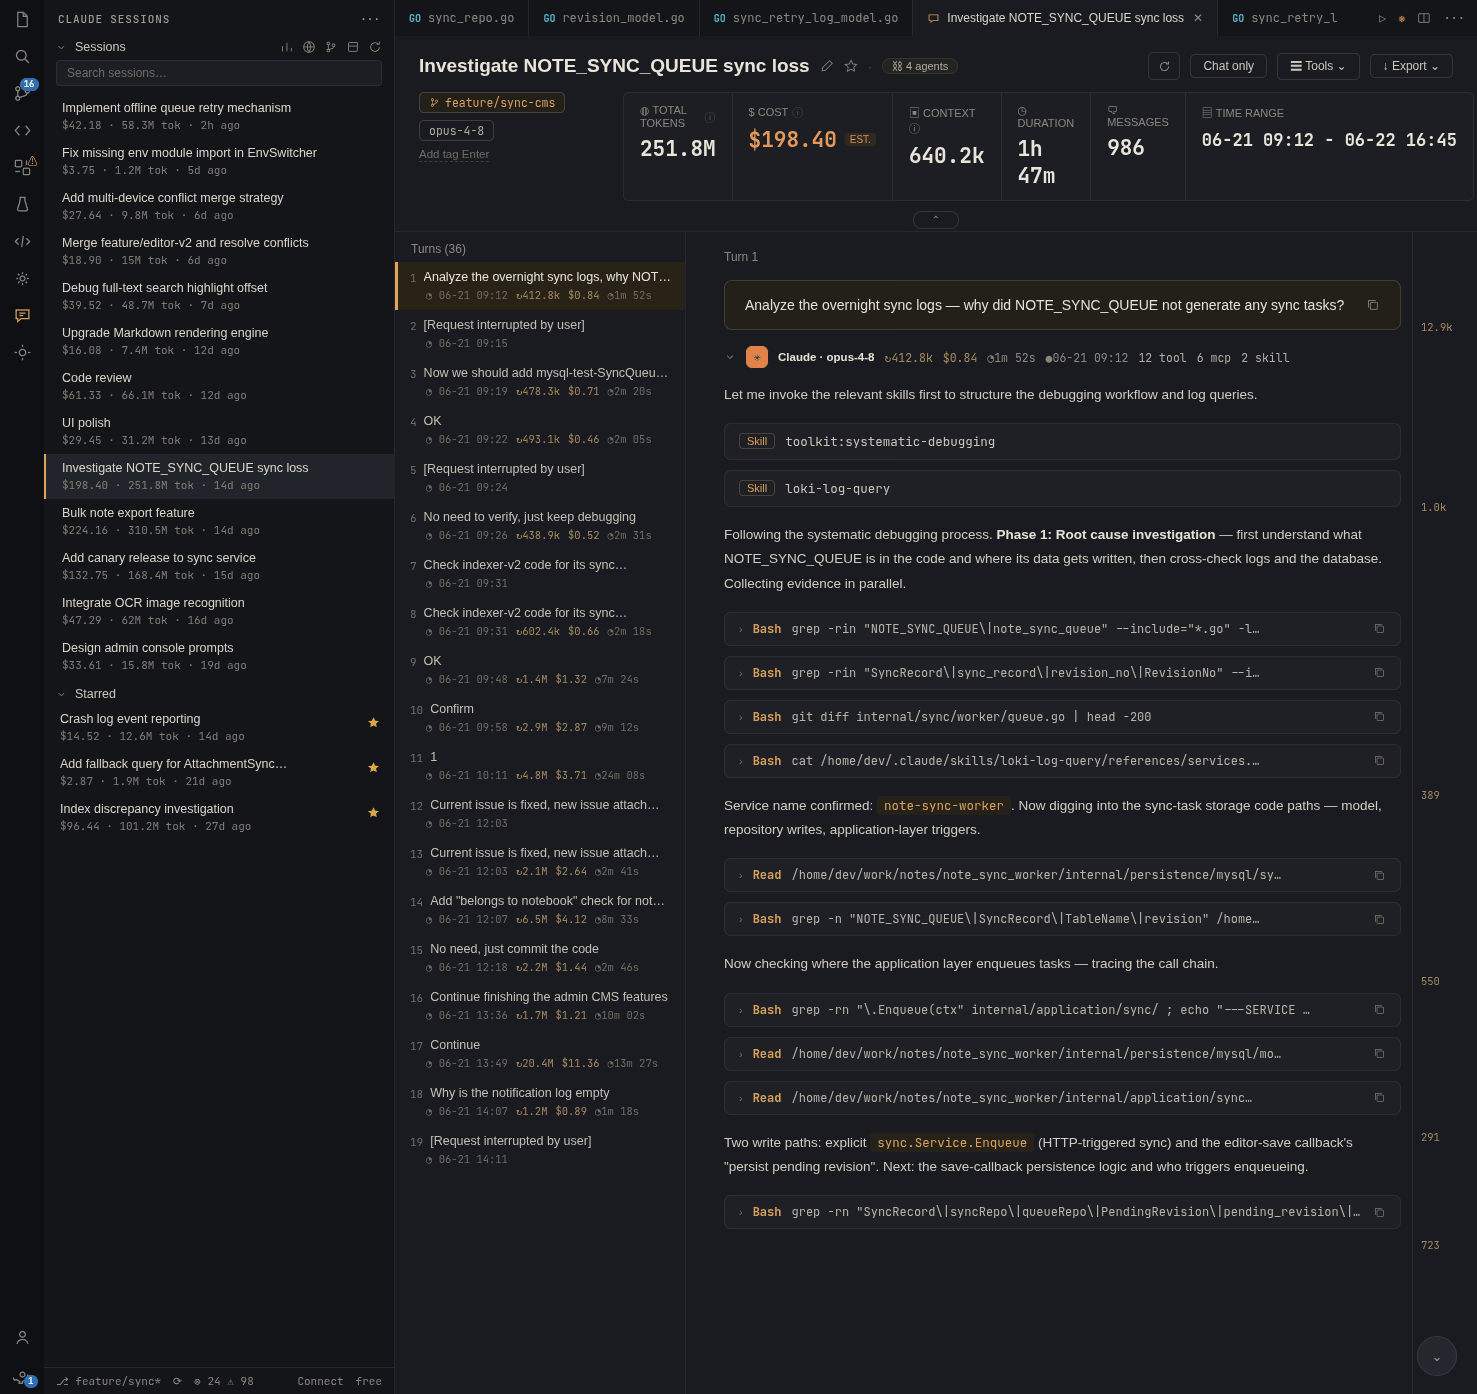
Click any session to open its detail panel, which shows:
- The full transcript.
- Every tool call and sub-agent run.
- A token, context, and cost breakdown — token counts combine input + output + cache-write + cache-read.
Close and reopen VS Code, and the detail panel you had open restores automatically.
Open the Analytics dashboard
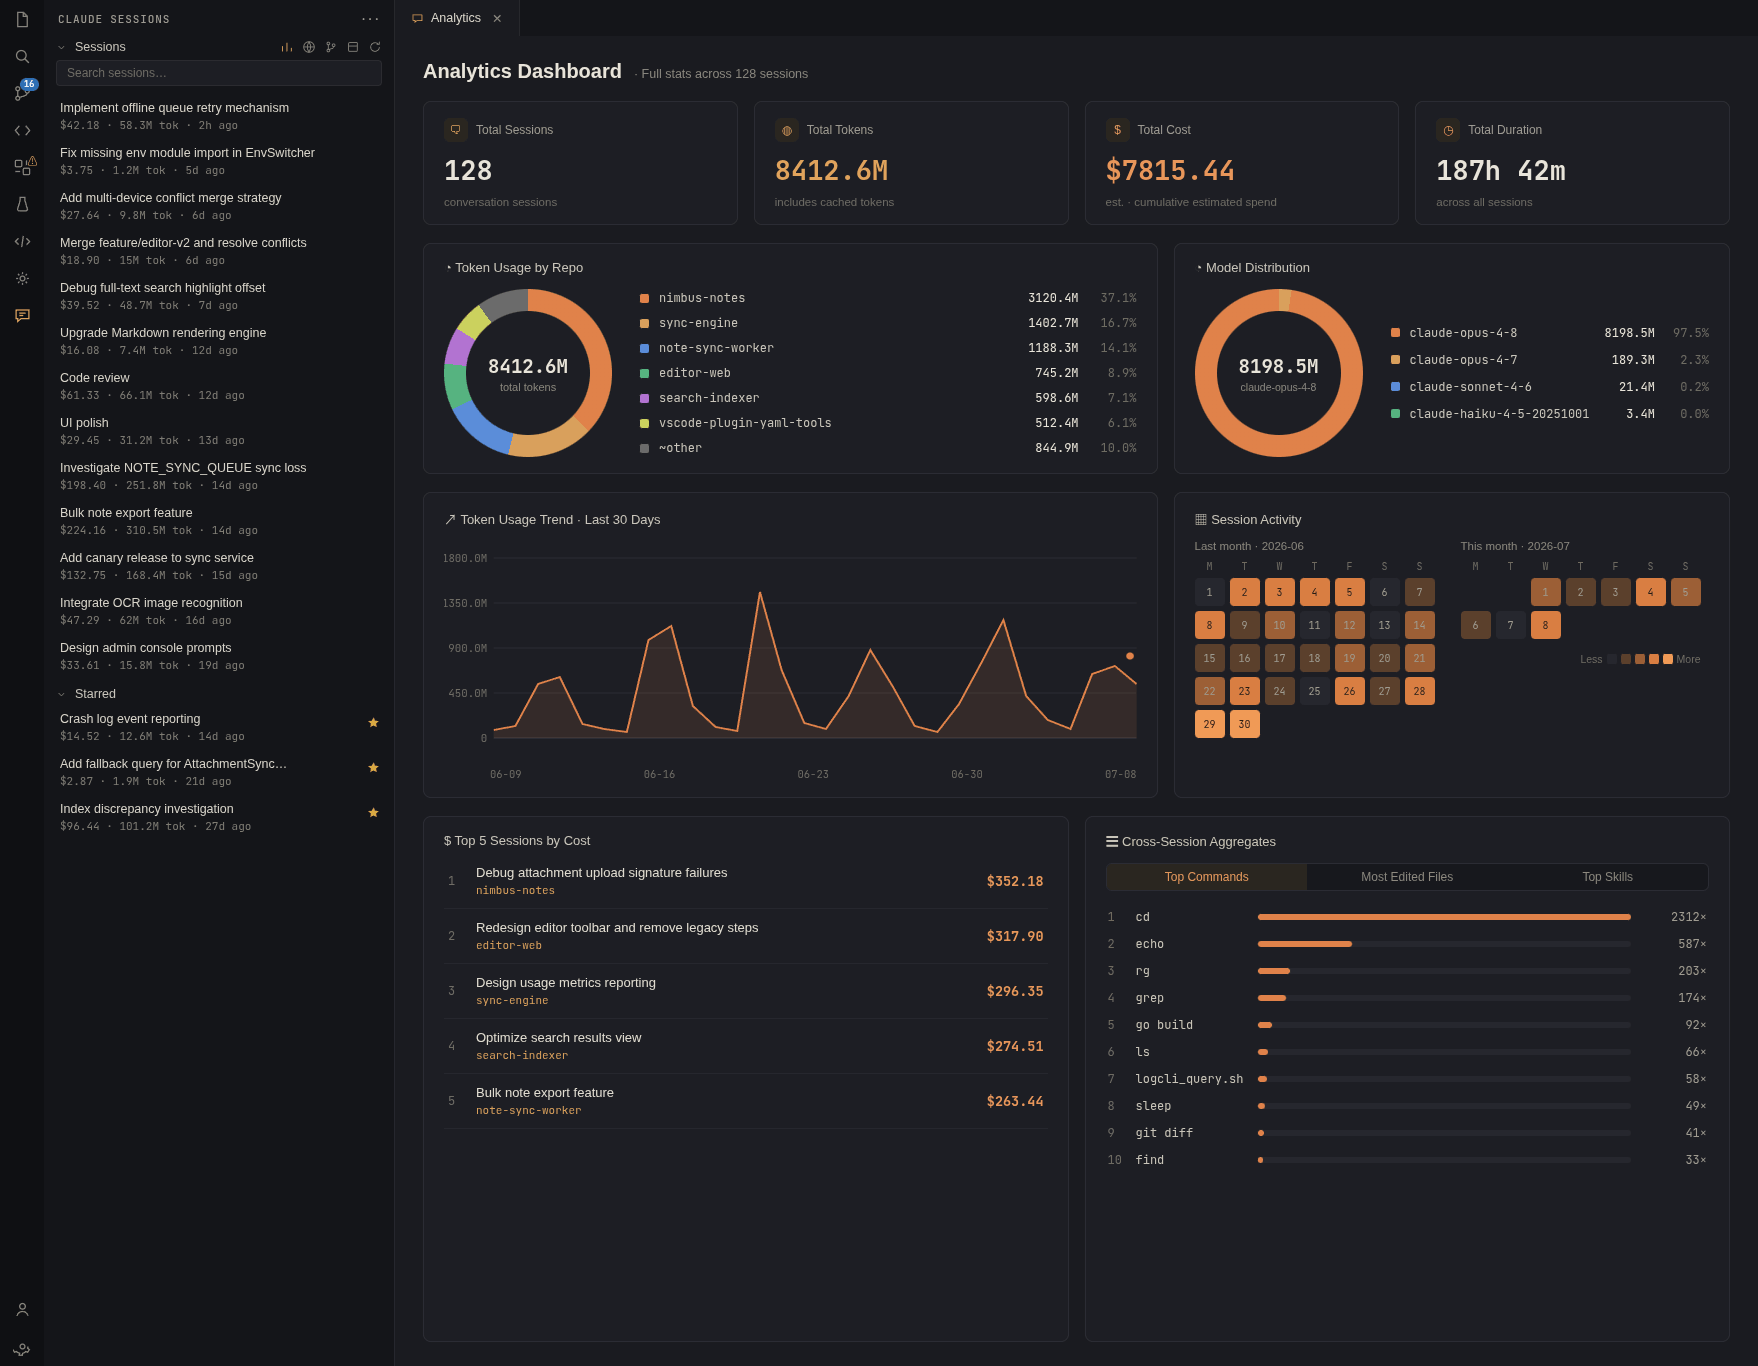
For the cross-session view — cost, token trends, tool-call distribution, and an activity heatmap — open the Analytics dashboard. There are two ways in:
- Click the session count shown in the status bar.
- Or use the entry point in the sidebar's view title bar.
Jump around with Quick Open
Once you have more than a handful of sessions, scrolling through the list gets slow. Press CtrlAltS (⌘⌥S on macOS) to bring up Quick Open, fuzzy-search by title, repository, or branch, and jump straight to the session you want.
That's the full loop — sidebar list, session detail, dashboard, and instant jumps with Quick Open.
Keyboard shortcuts
The commands you'll reach for most, with their default keybindings.
| Command | Keybinding | Where |
|---|---|---|
| CSM: Quick Open Session… | CtrlAltSor⌘⌥S | Anywhere |
| CSM: Refresh Sessions | CtrlRor⌘R | When the Sessions view is focused |
| CSM: Open Dashboard | Command Palette | Command Palette / view title |
Themes & languages
The whole UI automatically follows VS Code's light, dark, or high-contrast theme — no extra setup required. The interface is localized into English, Simplified Chinese, Spanish, Japanese, and Korean, matching whatever language VS Code is already set to.
For the full installation walkthrough, see the Install tutorial; for a deeper look at grouping, favorites, and search, see the Sessions sidebar and Dashboard tutorials.