Session detail
The session detail panel
Full transcript, tool calls and sub-agents, plus a token/context and cost breakdown that includes cache tokens.
The session detail panel is where Claude Session Monitor packs in the most information. Click any session in the sidebar and a themed panel opens on the right, bringing together the full transcript, tool calls and sub-agent activity, and a token/context and cost breakdown — all in one view.
What the panel shows
The core is the session's full transcript — every turn between you and Claude, in order — so you don't scroll back through terminal history to reconstruct what happened. Interleaved with it are two more layers:
- Tool calls — every tool Claude invoked (reading/writing files, running commands…) shown inline in the order it happened, so you can trace exactly what each step did.
- Sub-agents — if the session spawned a sub-agent, its own execution is represented on its own terms, not flattened into the main conversation.
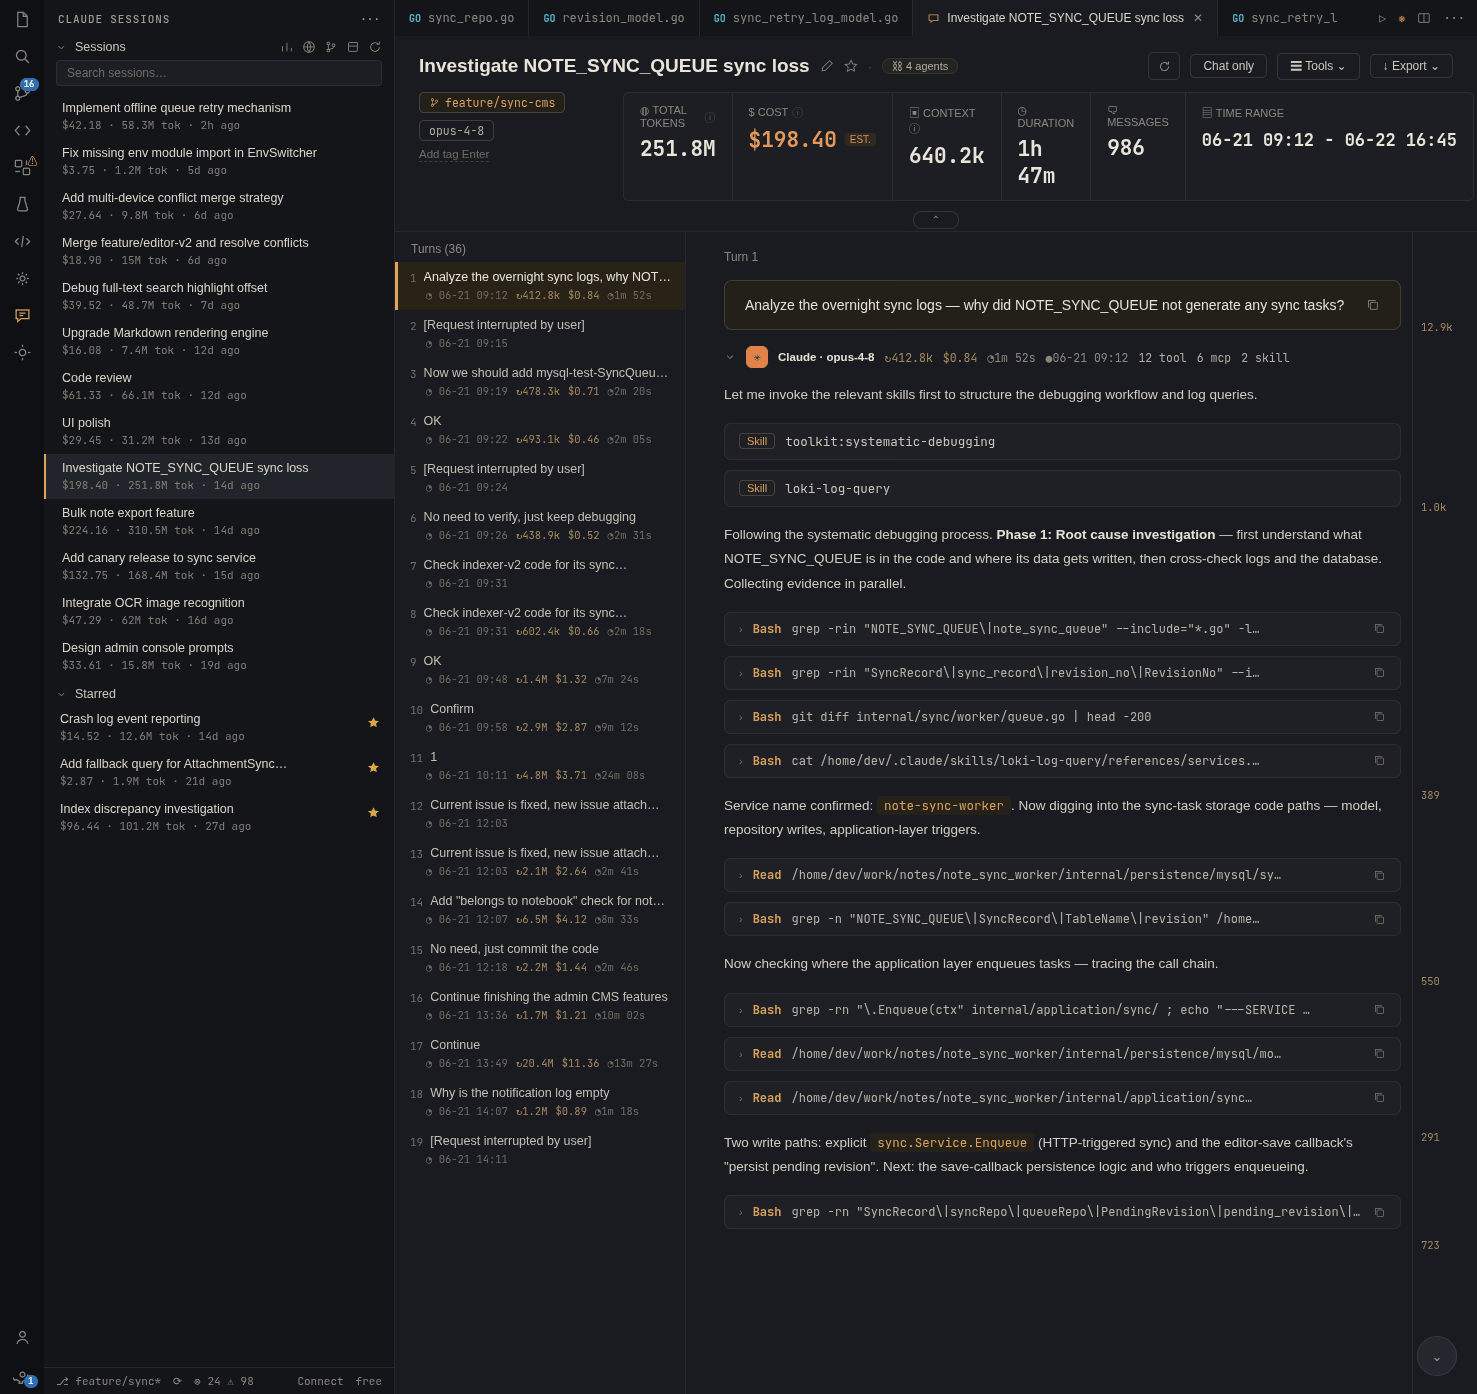
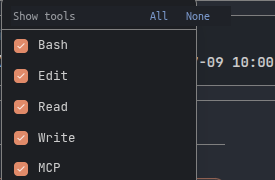
The panel follows VS Code's light, dark, and high-contrast themes, so it never looks out of place next to the rest of the editor.
The toolbar also carries a Continue button: it resumes that session with claude --resume, in the VS Code integrated terminal, an external terminal, or the official Claude Code extension. Pick once and you can make it the default, so it stops asking.
Two small actions live on the content itself. Since 3.1 every response card carries a copy button in its top-right corner, matching the one your own messages already had; it copies the answer text only, leaving out thinking blocks and tool calls, because the reason to copy a response is almost always to paste the answer somewhere else. And a Mermaid diagram in an answer offers two: copy its source, or open it in Mermaid Live to keep editing.
Finding your way around a long session
A session you have been working in all day is thousands of lines long, and 3.0 added three ways to deal with that. Opening a session now lands you on the newest turn rather than at the very beginning — a session is usually opened to see what just happened. Once you scroll yourself, that is never overridden.
Ctrl+F (Cmd+F on macOS) searches the open transcript, with match highlighting and next/previous navigation, so you can find the one command you ran without reading back through the whole day. And Open raw transcript opens the session's underlying .jsonl straight in the editor, for when you want the unrendered truth — or want to grep it with your own tools.
Token, context, and cost breakdown
The panel's other job is breaking down tokens and cost. The total token count uses this basis:
input + output + cache-write + cache-readCounting cache-write and cache-read isn't arbitrary — it matches how cost is actually computed. If the panel only counted input and output, a cache-heavy session would show a token count that's a tiny fraction of what's billed, making the cost look inconsistent. Counting all four keeps token and cost consistent with each other.
The cost figure is an estimate computed from each model's own pricing (including separate cache-write and cache-read rates). It won't match your invoice to the cent, but it's accurate enough to see roughly what a session cost and which token category drove it.
You don't have to take the total on faith. Next to the total-token stat sits an ⓘ info icon; hover or click it to open a Token breakdown popover that splits the total into four parts — input, output, cache write, and cache read — so you can see at a glance which category dominates.
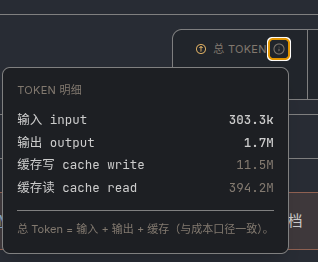
A line at the bottom of the popover spells out the basis — total = input + output + cache — the same accounting used for cost. That distinction matters most on a cache-heavy session: the screenshot above reads 394.2M cache-read against just 303.3k input, so counting only input and output would understate the real total by orders of magnitude.
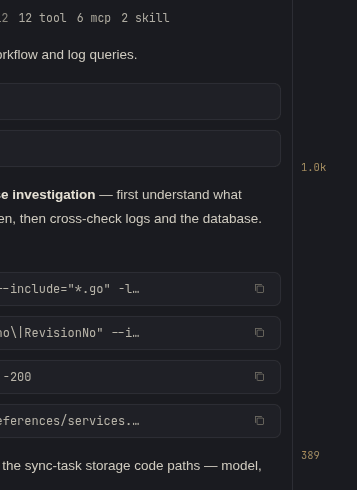
Zoom out and every API response is tagged with its own token count, too. Along the right edge of the transcript, each model response carries a thin accent bar spanning its height and a small number in the gutter — that response's context size (input + cache write + cache read), the same basis as the Context stat in the header. It's the quickest way to spot which single response carried the most context.
See the code Claude changed
Whenever a response touched code, its header carries a badge like 6 files +177 -100. Click it to review exactly what changed in that step.
In VS Code the changes open in the editor's own multi-file diff view, so you get the diff UI you already know — inline or side-by-side, navigation between files, your usual settings. On the web a changes viewer opens beside the transcript: a file tree (switchable to a flat list, with a filter box) next to a full diff with line numbers, hunk headers, syntax highlighting, and word-level highlighting of what actually changed inside a line.
Changes are aggregated per file: a file edited five times within one response shows up as a single net diff, not five fragments. The turn outline on the left marks every turn that touched code with the same badge, so you can find where the work happened without scrolling. File paths are shown relative to the project (web/src/lib/types.ts rather than the full absolute path); hover any path to see it in full.
Since 3.0 each row in VS Code's diff editor also carries the actual file:// URI, so Open File, the breadcrumb and the path label all resolve to the source on disk instead of dead-ending in a virtual document. Both sides of the diff remain the historical snapshot of that turn — what you are comparing is still what this response changed, not history versus now — and a file the turn created is marked as an addition rather than diffed against an empty file.
The panel remembers what you had open
Reload the VS Code window and the detail panel you had open — along with the dashboard, if it was open — is restored automatically. No need to return to the sidebar and re-open the session.