Analytics dashboard
The analytics dashboard
Cost, token trends, tool distribution, an activity heatmap, and cross-session aggregation — every session on your machine in one place.
Scrolling through sessions one by one won't tell you how much you spent this week or which tool you call most. The analytics dashboard aggregates every session and lays out cost, token trends, tool distribution, and an activity heatmap in one place.
Opening the dashboard
Three entry points, all leading to the same panel:
- Click the status bar — it shows your current session count; click it to open the dashboard.
- Command palette — run the Open Dashboard command.
- Sessions view title bar — an action button there opens the dashboard.
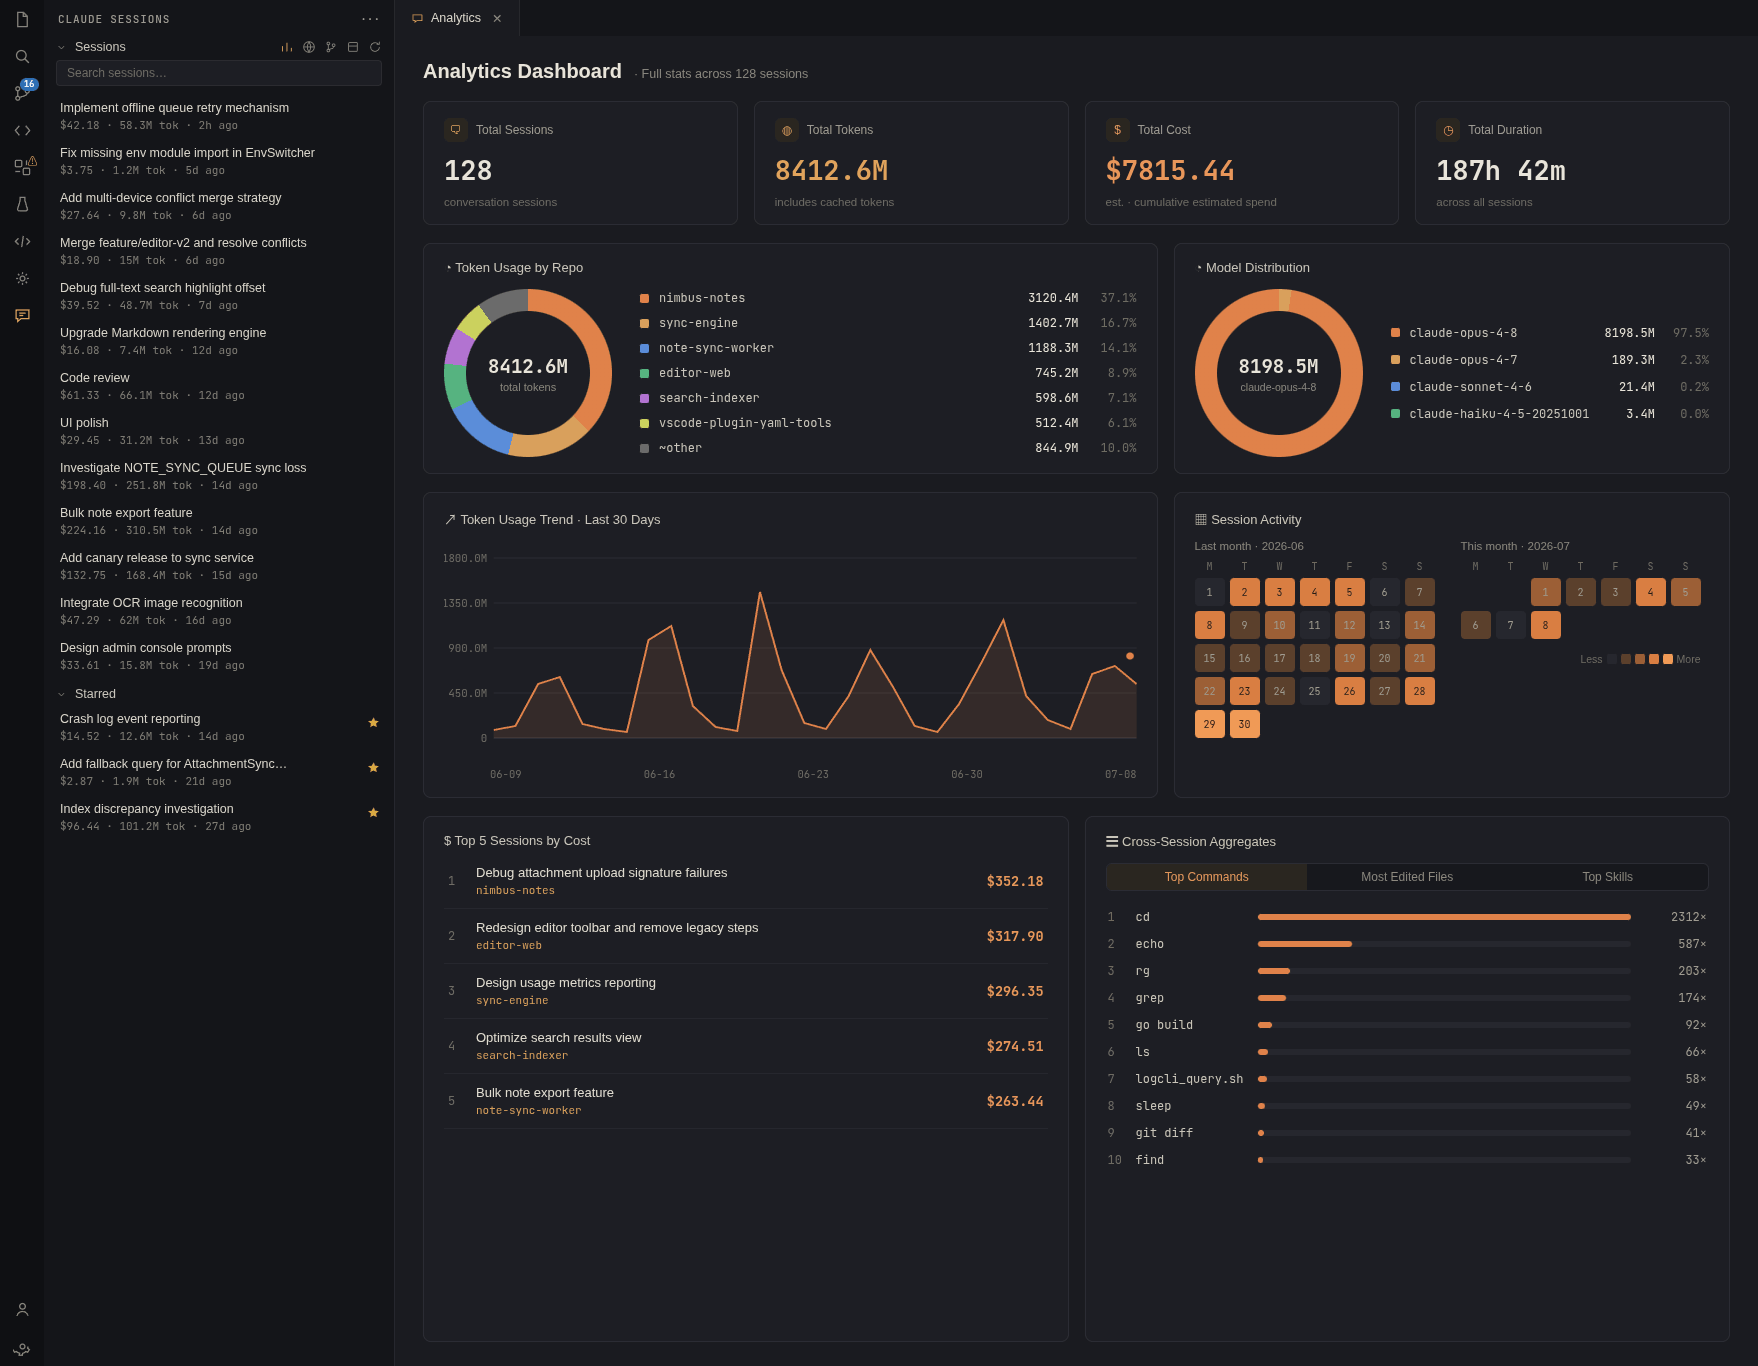
What each part shows
Cost
Cost is an estimate from per-model pricing, including the separate cache-write and cache-read rates. Because caching mixes regular and cached tokens into the same request at different rates, pricing based only on plain input/output would undercount — the dashboard accounts for all of it.
This figure is derived from published per-model pricing as a reference, not an official invoice. Check your account billing for the actual charge.
Token trends
Token totals add input, output, cache-write and cache-read together — not just input plus output. Plain input/output numbers from a conversation view read noticeably lower because the cache portions are missing. Watching the trend is a quick way to notice when a project's context has grown large enough that cache tokens dominate.
Tool distribution
Tool distribution shows the share of each tool-call type (file reads/writes, command execution, and so on) across all sessions, so you can see which operations you actually rely on most.
Activity heatmap
The heatmap lays your usage out along a time axis, making it easy to spot heavy and quiet periods — useful for understanding your own working rhythm rather than any single session's timeline.
Cross-session aggregation
None of these views are scoped to a single session — they're computed across every session scanned on your machine, giving one overall picture. That's what sets the dashboard apart from the detail panel: the detail panel is about one conversation, the dashboard about all of them.
The panel remembers itself
Like the detail panel, the dashboard is restored automatically after you reload the VS Code window — no need to click the status bar or run the command again.